The influenza virus, in its many strains, is responsible for everything from seasonal flu to the occasional pandemic. It is an RNA virus whose genome is split into 8 strands, each neatly wrapped around packaging proteins in order to fit in the virus’s envelope. While most of the RNA genome is wrapped around the nucleoproteins, the termini are thought to remain uncomplexed and interact with each other.
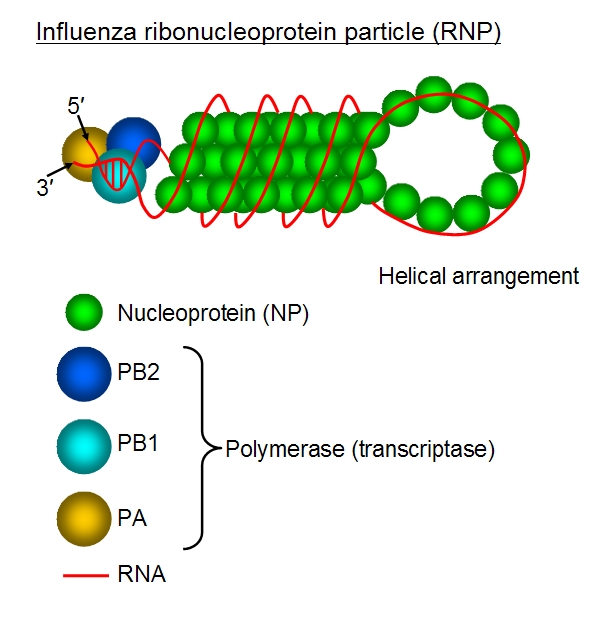
Fig. 1: Segment 5 of the influenza virus, wrapped into a ribonucleoprotein particle
It’s been speculated that this packaging is mediated by RNA secondary structure. The purpose of this project was to search for evidence of that structure in silico. We found windows of low sequence diversity matching our expectations, but we didn’t find evidence of co-evolving nucleotides.
This was a group project that I completed during my PhD in Bioengineering, in the context of a Computational Biology class that I took at MIT.
Data sources
We used 2912 unique sequences from the Influenza Research Database (IRD). We focused on segment 5 because it isn’t divided into multiple subtypes or alleles, and is also the shortest of the 8 segments in the genome.
We used Clustal Omega to perform a nucleotide multiple sequence alignment. In order to prevent alignment problems, we trimmed gaps at the sequence termini and removed about 1% of the sequences that had other gaps. This resulted in 2895 gap-less coding sequences. The IRD data come as sense strands of DNA, as opposed to the negative sense RNA of influenza viruses. We thus reverse-complemented our sequences before performing entropy and mutual information calculations, and transcribed them into RNA prior to performing in silico folding.
Measuring sequence diversity to find conserved regions
Given the importance of RNA packaging for viral replication, if the terminal ends are important for packaging then we’d expect them to be highly conserved, which would show up as relatively low sequence diversity. Previous sequence diversity analyses had been performed on a few hundred viral sequences1, and had identified low sequence diversity at both termini of each segment. We successfully replicating their findings by calculating a rolling average of the local Shannon entropy, using a 39-nucleotide (13 amino acid) window throughout Segment 5 (Fig. 2). Our work shows that their conclusions can be extended from the few original sequences to the entire currently known dataset.
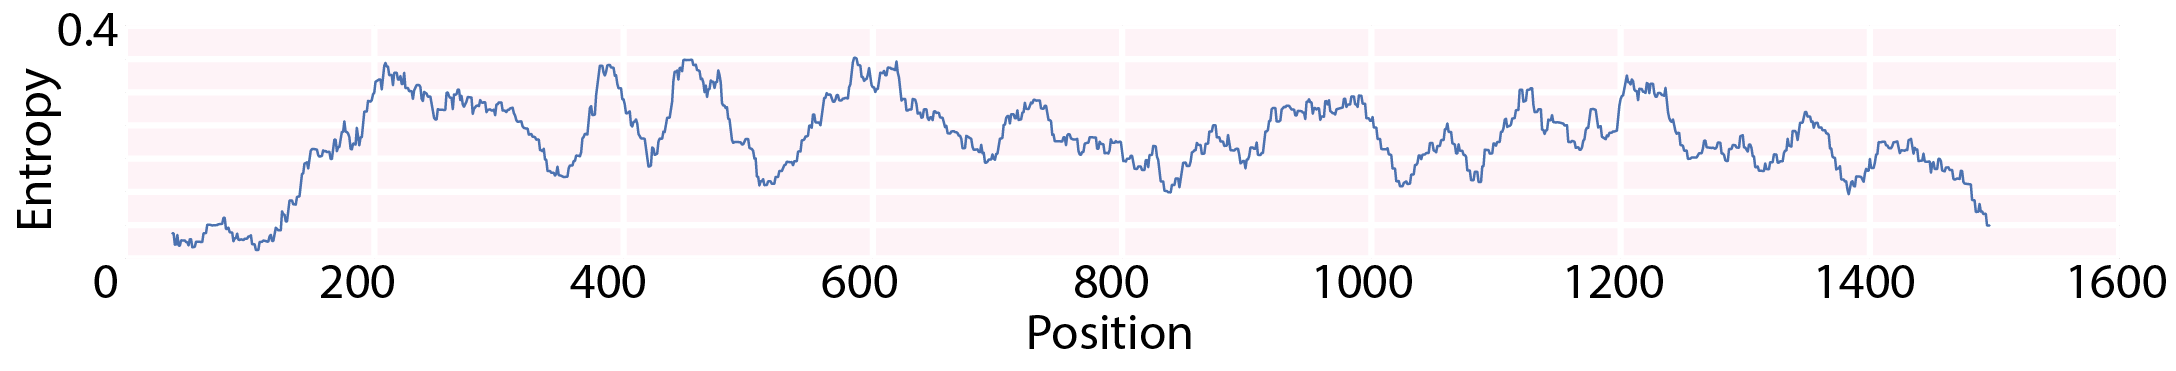
Fig. 2: Segment 5 entropy, averaged over a rolling window of 39 nucleotides. The terminal regions have low sequence diversity.
We then measured entropy with single-nucleotide resolution (Fig. 3), finding a 25-nucleotide window of unusually low sequence diversity near the 5’ end (positions +20 to +45) and a 13 nucleotide window (positions -22 to - 10) at the 3’ end. Windows of low sequence diversity support our hypothesis, because a conserved secondary structure requires a conserved RNA sequence.
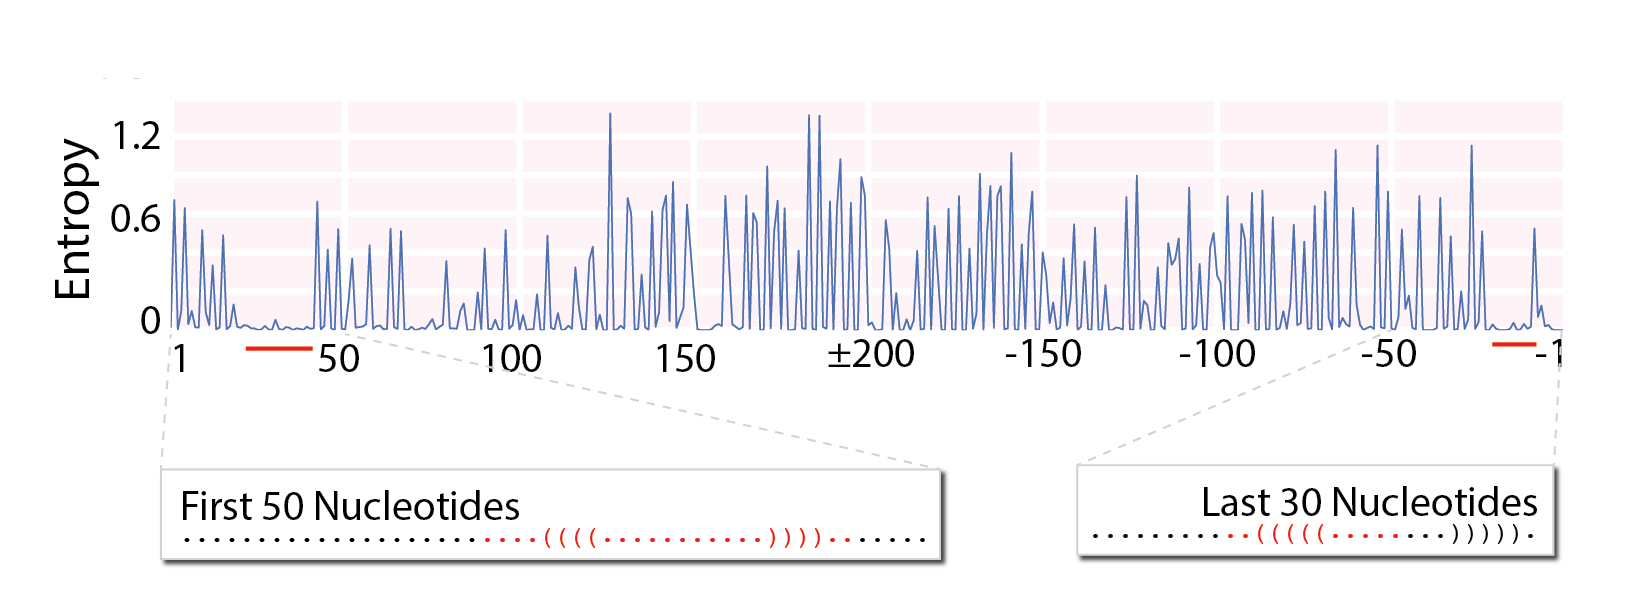
Fig. 3: Segment 5 entropy, calculated for each nucleotide. Windows of particularly low sequence diversity show up at the termini, and are marked here with predicted secondary structures for those regions.
Simulating potential secondary structures
To directly search for secondary structure at these windows of low sequence diversity, we individually tested subsets of these regions using RNAalifold from the ViennaRNA package3. Due to the limitations of RNAalifold, we used a randomly sampled subset of 400 sequences from the 2895 in the database. We only tested for secondary structure formation within each packaging region. We extracted the first and last 100 nucleotides of Segment 5. We then performed in silico folding on 20 sequences of increasing length (10, 20, … 100 nucleotides) starting at the 5’ or 3’ end, obtaining the predicted secondary structure and its associated free energy of formation.
The sequence fragments we analyzed formed stem loop structures at positions 20 to 45, and at positions -22 to -10 (Fig. 3d, e, f). These stem loops were the most common structures across the sequence fragments that we tested. They also map to positions with low Shannon entropy (Fig. 3d), though it’s not clear that this correlation is meaningful for our hypothesis.
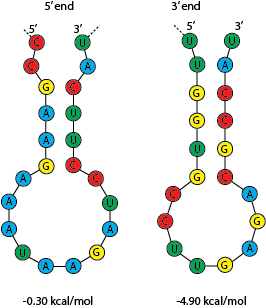
Fig. 4: Predicted stem loops for the 5’ and 3’ regions respectively.
Measuring mutual information to find co-evolving nucleotides
Given our structural hypothesis, we expect that the two packaging regions will either fold locally or base pair with one another. If they pair with one another, the nucleotides in one region should have a conserved relationship with the nucleotides in the pairing region; if one mutates, the other one must change to compensate or the structure will be lost. This relationship would show up as high mutual information (MI). Indeed, previous studies on RNA folding algorithms2 point out that stems of secondary structure are characterized by anti-diagonal “stripes” of high MI.
MI can be detected computationally, by balancing an anti-diagonal measurement against a diagonal control, but we opted for visual inspection since we had only one plot (Fig. 4b). We used the MI algorithm implemented in scikit-learn to compute pairwise MI for the first and last 200 nucleotides of Segment 5. We chose this subset of positions to reduce computational runtime; it extends far enough into the interior of Segment 5 that any potential structure in the packaging regions should be included.
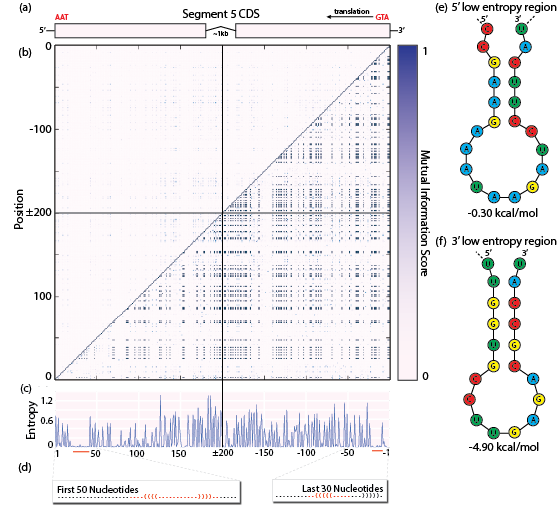
Fig. 4: (a) Sequence coordinate system. 5’ end encodes the stop codon, 3’ end encodes the start codon. (b) Mutual information score matrix. Top-left: mutual information score. Bottom-right: normalized mutual information score. (c) Entropy of the first 200 and last 200 nucleotides. Red bars: regions of unusually high sequence conservation. (d) Mapping of the predicted secondary structures to the regions of low sequence diversity. (e) and (f): Predicted stem loops for the 5’ and 3’ regions respectively.
With positions that are perfectly conserved, mutual information scores involving those positions will always be zero. Nonetheless, they could be part of a perfectly conserved secondary structure. This is why we also computed normalized mutual information (NMI), another function implemented in scikit-learn. Pairs of perfectly conserved positions will have an NMI score of 1.0 (Fig. 3b, bottom-right). Using NMI, we expect that all anti-diagonal patterns should be visible regardless of whether they are caused by mostly or perfectly conserved positions in Sequence 5. Our mutual information heat map (Fig 3b), does not contain any discernible anti-diagonal stripes of MI or NMI. There are no patterns that would indicate RNA secondary structure to the naked eye, either within or outside the packaging regions.
Future work
An appropriate background model for this set of sequences, which we did not consider here, would be to permute the codon usage and generate a synthetic background data set of comparable size (~3000 sequences), using the measured codon usage frequencies for that particular segment. For each amino acid in each sequence, we would randomly select a codon for that amino acid at that position (proportional to that amino acid’s codon usage frequencies). This would provide a set of sequences under amino acid sequence constraint but not under RNA sequence constraint. This background data could be used to assess the significance of our entropy results, by comparing our observed entropy to the expected background entropy at each position.
References
-
Gog, J. R. et al. Codon conservation in the influenza A virus genome defines RNA packaging signals. Nucleic Acids Res. 35, 1897–1907 (2007). ↩
-
BINDEWALD, E. & SHAPIRO, B. A. RNA secondary structure prediction from sequence alignments using a network of k-nearest neighbor classifiers. RNA 12, 342–352 (2006). ↩
-
Lorenz, R. et al. ViennaRNA Package 2.0. Algorithms Mol Biol 6, (2011). ↩